Summary
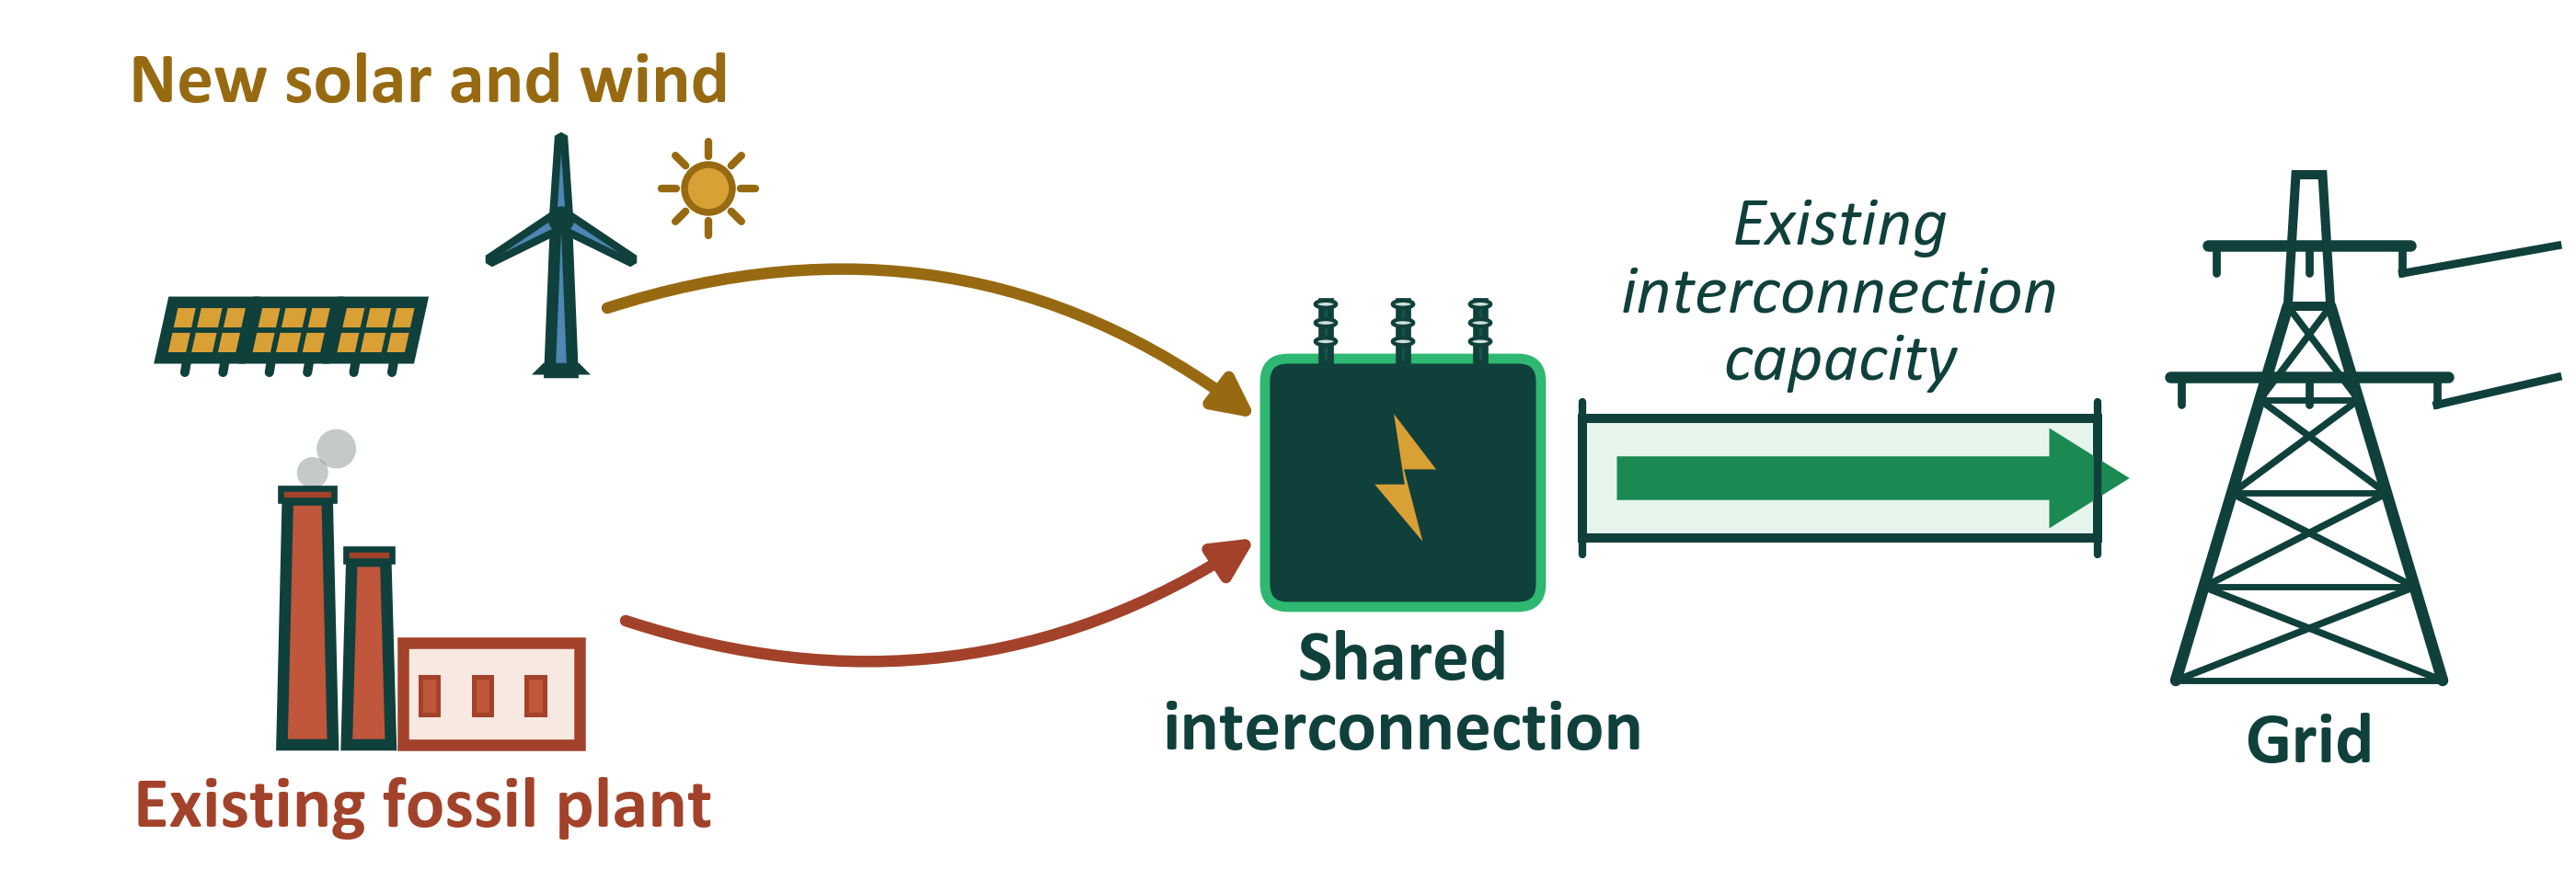
Surplus interconnection service introduced by FERC in 2018 allows new generation and storage to be added at underutilized existing interconnections. It can add both generation and accredited capacity. One use case is an expensive gas peaker that runs only a few percent of the year. Its interconnection is already paid for but sits idle, so cheaper new generation like solar can use it. Another is an existing solar or wind plant with low capacity value. A battery there raises its accredited capacity and interconnection utilization.
California's existing plants can add 34,156 MW of solar and 1,996 MW of wind, and renewable plants can add 21,249 MW of batteries. In total, California's existing plants can add 57.4 GW of new nameplate capacity. The CPUC's 2021 planning values put interconnection at $200 per kW for solar and $100 per kW for batteries. At those rates the 57.4 GW of new solar, wind and batteries avoid about $9.4 billion.
The problem
82.3 GW of projects wait in California's queue. Solar plus batteries and stand-alone storage lead California's queue. But about four in five California projects that applied to CAISO have dropped out.
Figure 1. Median months from request to operation, projects built 2023 to 2025Projects in CAISO's queue also take longer to reach operation than in other regions. Sources: CAISO Public Queue Report, 26 September 2026, and Cluster 15 Queue Report, 16 July 2026: active requests at California sites, net MW at the point of interconnection; LBNL, Queued Up: 2026 Edition, June 2026, and its data file: our medians for projects that reached operation from 2023 to 2025.
Show the data as a table
Region Median months, request to operation CAISO 98.7 PJM 70.9 MISO 65.0 Southeast 56.9 SPP 56.1 Other West 49.1 ERCOT 45.8 California's resource adequacy price more than tripled from 2019 to 2025. The average contract price rose from $3.46 per kW-month in 2019 to $14.51 in 2024. In 2025 California's price was $142 per kW-year, above PJM's $99 and MISO's $79.
California households pay $722 a year more than at 2019 prices. Residential prices rose 64 percent from 2019 to 2025. The average price went from 19.15 cents per kWh to 31.35 cents. Consumer prices rose 26 percent from 2019 to 2025, against 64 percent for residential electricity prices.
CAISO's gas plants still supply 6.8 GW at 9 PM. Over the 12 months to September 2026, gas in CAISO's area ran through the afternoon and the night. Batteries now supply part of the evening. At 9 PM, average battery output rose from 2.7 GW to 6.2 GW in two years.
Figure 2. Average supply by hour, 12 months to September 2026 (GW)At 9 PM gas is the largest source, ahead of batteries. Average output at 9 PM, 12-month periods (GW)
Sources: CAISO Today's Outlook, fuel-source history, five-minute MW by source, 26 September 2023 to 25 September 2026; EIA-930 hourly generation by source, 2023 and 2024; EIA, Today in Energy, 28 May 2025.
Show the data as a table
Hour Nuclear (GW) Other renewables (GW) Large hydro (GW) Wind (GW) Imports (GW) Solar (GW) Gas (GW) Batteries (GW) 12 AM 2.1 1.4 2.7 3.4 7.0 0.0 6.5 1.2 1 AM 2.1 1.4 2.6 3.3 7.1 0.0 6.3 0.4 2 AM 2.1 1.4 2.4 3.2 7.2 0.0 6.1 0.0 3 AM 2.1 1.4 2.4 3.1 7.1 0.0 6.0 0.0 4 AM 2.1 1.4 2.4 3.0 6.9 0.0 6.0 0.0 5 AM 2.1 1.4 2.5 2.9 6.6 0.0 6.1 0.9 6 AM 2.1 1.4 2.4 2.7 5.8 1.0 6.2 2.1 7 AM 2.1 1.4 2.0 2.4 4.6 6.6 5.6 0.0 8 AM 2.1 1.3 1.3 2.2 3.0 13.3 4.4 0.0 9 AM 2.1 1.3 1.0 2.1 2.2 16.1 3.9 0.0 10 AM 2.1 1.3 0.8 2.0 1.8 17.0 3.7 0.0 11 AM 2.1 1.3 0.7 2.1 1.6 17.3 3.7 0.0 12 PM 2.1 1.3 0.7 2.2 1.3 17.3 3.7 0.0 1 PM 2.1 1.3 0.7 2.3 1.1 17.1 3.8 0.0 2 PM 2.1 1.3 0.8 2.5 0.9 16.5 4.0 0.0 3 PM 2.1 1.3 1.1 2.7 0.9 14.8 4.4 0.0 4 PM 2.1 1.3 1.7 2.9 1.7 11.8 5.2 0.0 5 PM 2.1 1.4 2.4 3.1 2.6 8.7 5.9 2.4 6 PM 2.1 1.4 3.1 3.2 3.9 4.3 6.5 5.1 7 PM 2.1 1.4 3.4 3.3 4.5 0.7 6.8 7.3 8 PM 2.1 1.4 3.4 3.4 4.9 0.0 6.8 7.2 9 PM 2.1 1.4 3.3 3.4 5.3 0.0 6.8 6.2 10 PM 2.1 1.4 3.2 3.4 6.4 0.0 6.7 3.9 11 PM 2.1 1.4 3.0 3.4 6.7 0.0 6.6 2.1 CAISO expects $45.8 to $63.2 billion of new transmission by 2045. CAISO's estimate rose from about $30.5 billion in its 2022 outlook to $45.8 to $63.2 billion in its 2024 outlook. CAISO says newly approved transmission can take 8 to 10 years to complete.
The solution
Renewables at fossil plants
Batteries and new generation at renewable plants
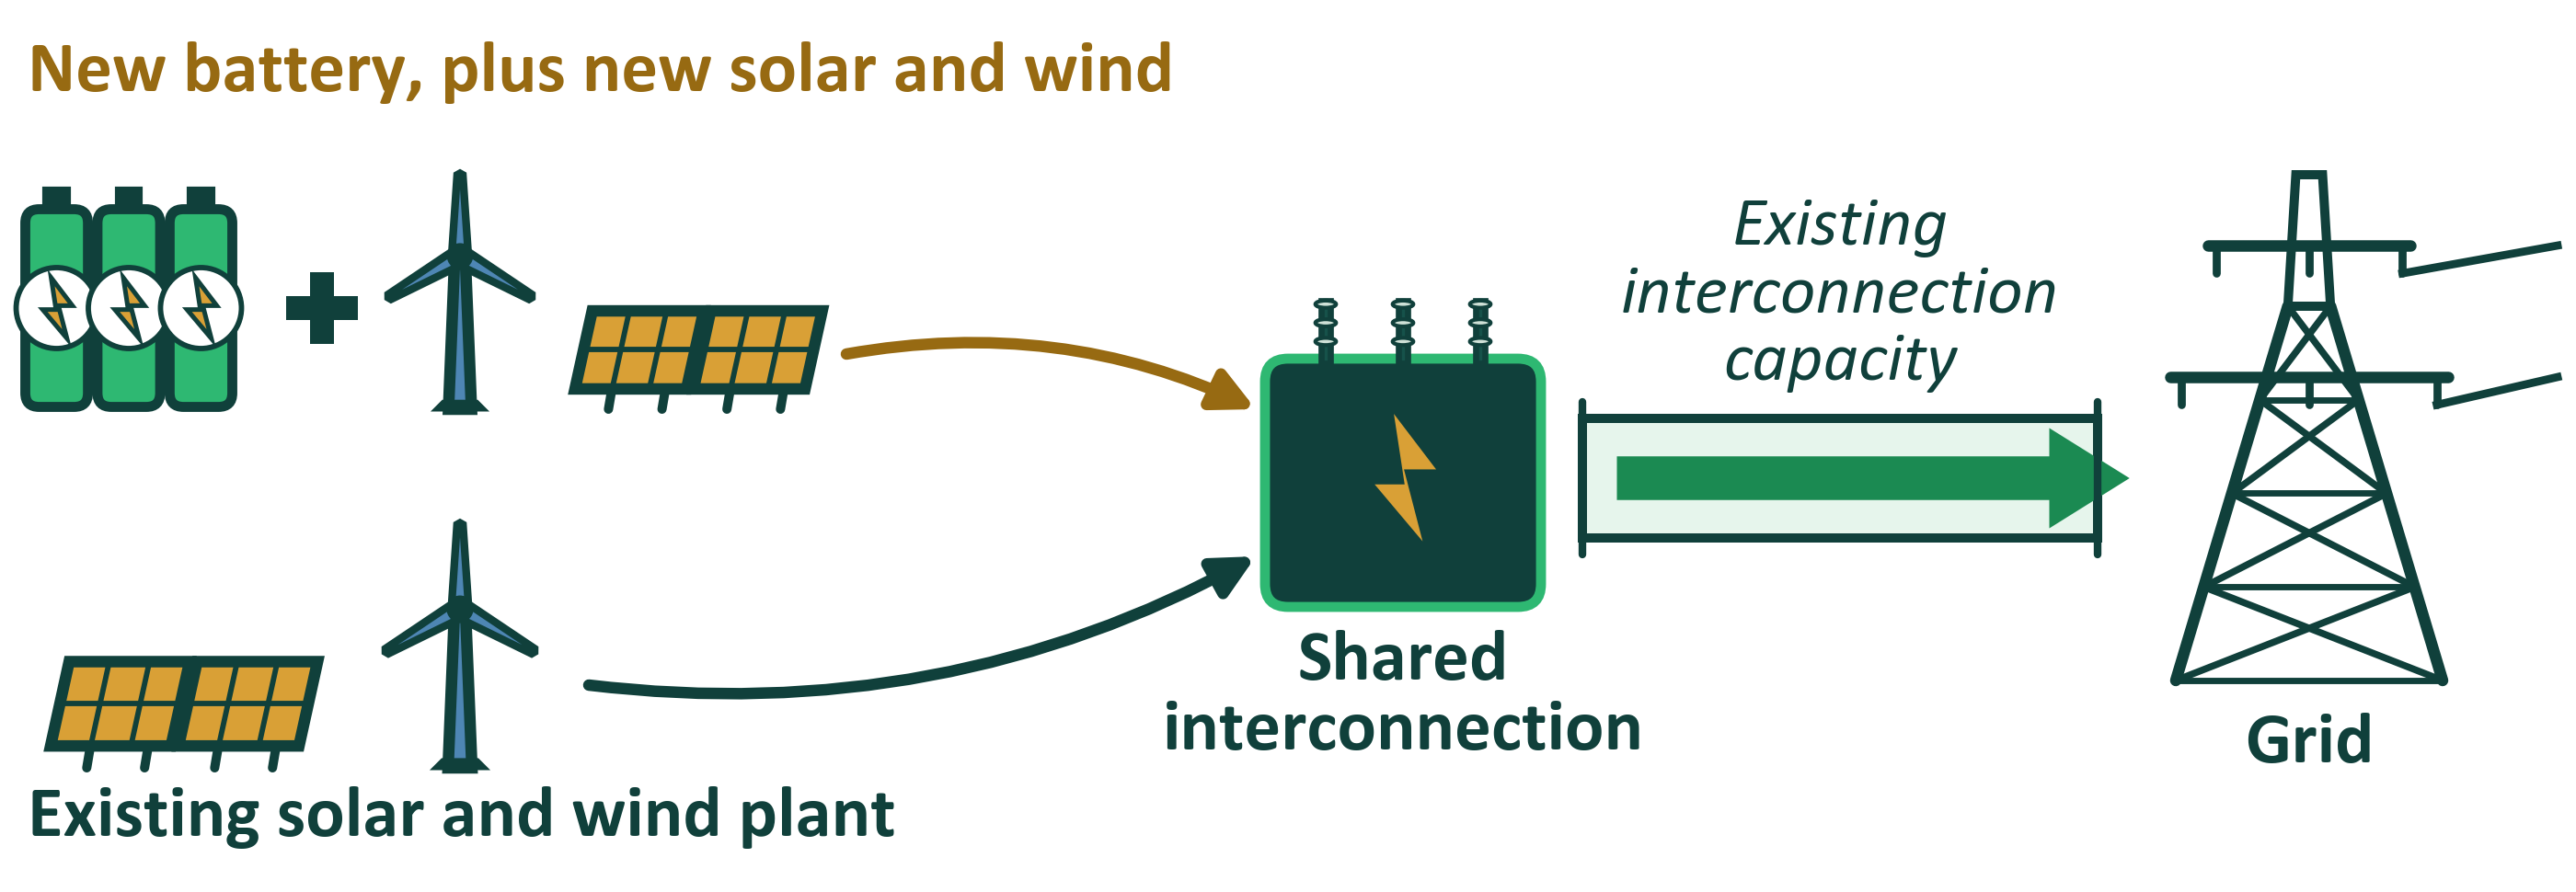
2.1 GW of batteries were added at existing California solar and wind plants. Most batteries added at California's solar and wind plants came through CAISO's modification process. Batteries added this way reached operation a median of 18.5 months after their request. Projects in CAISO's queue took a median of 99 months.
Nearly half of California's fossil capacity runs below a 15 percent capacity factor. New solar can use the interconnection capacity these plants leave unused, without a new interconnection. Renewable plants leave most interconnection capacity unused. In 2025 solar plants ran at a 27.2 percent capacity factor and wind plants at 26.7 percent.
Figure 4. Fossil capacity by 2025 capacity factor (MW)Most of California's fossil capacity ran below a 30 percent capacity factor in 2025. Sources: EIA-923 net generation and EIA-860 nameplate capacity, 2021 to 2025; EIA-923 fuel receipts and fuel use, 2025; EPA hourly emissions data; California and Quebec carbon allowance auction, August 2026. Nuclear plants are excluded.
Show the data as a table
2025 capacity factor Fossil nameplate (MW) Below 15 percent 16,042 Below 30 percent 24,634 All fossil plants that reported output in 2025 34,012 The new capacity at existing plants totals 57.4 GW of nameplate. Solar is 34.2 GW of it, with 8.9 GW at gas plants where new solar costs less than running the plant in 2027, and 25.3 GW at existing solar and wind plants. Batteries are 21.2 GW and wind 2.0 GW.
Figure 5. 57.4 GW of solar, wind and batteries could be added at existing plants Fossil plants (120), MW
Renewable plants (283 solar, 77 wind), MW
Fossil plants (120), MW
Renewable plants (283 solar, 77 wind), MW
Sources: our hourly dispatch model, weather year 2019; EIA-860 and EIA-923, 2025; BloombergNEF 2026 levelized costs. Totals may not add because of rounding.
Show the data as a table
Plants Capacity MW Fossil plants Existing fossil capacity 34,102 Fossil plants New solar in 2027 8,884 Solar and wind plants Existing solar 22,287 Solar and wind plants Existing wind 6,355 Solar and wind plants New solar 25,272 Solar and wind plants New wind 1,996 Solar and wind plants New 4-hour batteries 21,249 Total new capacity 57,401 93 percent of California's plants have land for solar five times the interconnection. New solar would use 4 percent of the buildable land near existing plants. At most plants the interconnection limits the new solar, because the land could hold far more.
Existing interconnections avoid $9.4 billion of one-time interconnection cost. The new projects avoid this cost because they share an interconnection that is already built. Customers share the saving, because in CAISO they repay much of the interconnection cost through transmission rates.
Methods
Resource assessment
- Assessed solar and wind resources within a 6-mile buffer around each fossil and renewable plant in California.
- Applied more than 50 exclusion criteria: physical limits such as land cover and slope, environmental protections, protected areas such as national parks, and local ordinances, including setbacks from buildings, roads and power lines.
- Estimated local solar and wind potential from the suitable area and the average solar and wind capacity density.
Economic analysis
- Estimated hourly solar and wind generation near each plant with 2019 weather data from ERA5 for solar and MERRA-2 for wind.
- Estimated local solar and wind LCOE with BloombergNEF capital costs and compared it with each fossil plant's variable cost to find the economic crossover points.
- Solar and wind costs do not include the ITC or PTC, but battery costs include the ITC.
Portfolio optimization
- Estimated the mix of solar, wind and storage that maximizes interconnection utilization while keeping curtailment below 5 percent.
- For fossil plants, estimated the solar and wind capacity that can be added.
- For renewable plants, estimated the additional solar and wind capacity that a 4-hour battery enables.
- Added solar and wind only where the resource is good, about a 20 percent capacity factor for solar and 30 percent for wind, so the additions are economic.
Accredited capacity and savings
- We rate the additions with the CPUC's 2028 ELCC ratings.
- A 4-hour battery is rated at 76.5 percent. Solar is rated at 8.8 percent and wind at 14.7 percent.
- We estimate the one-time interconnection cost the additions avoid by sharing existing interconnections.
Policy options
Steps California agencies and CAISO could take
Publicly owned utilities outside CAISO could take these steps too, including the Los Angeles Department of Water and Power.
This analysis takes no position on any enacted, pending or failed bill.
Surplus rules change often, so the latest rules could differ.
The rules are as of 9 November 2026.
How to cite
Paliwal, Umed (2026). Surplus Interconnection in California. UC Berkeley. Version 2. https://www.repowercalifornia.com
About
This site presents independent technical analysis by Umed Paliwal at UC Berkeley.
Questions and corrections: umed@berkeley.edu.